One of the most important aspects of a centralised, integrated cloud-based restaurant management software (such as SpeQue) is the ability to pull detailed reports and analytics on the go.
Reporting doesn't just involve looking at a bunch of tabular/graphical data to see some numbers. Analyzing reports regularly can help restaurant owners check your restaurant’s pulse, even when you can’t be there yourself. Reports can also provide insights that you might not have thought to track, such as how accurately you’re quoting wait times.
Where business insights are concerned, more data doesn’t necessarily mean better comprehension. Without access to automated reports, revelations can be hard to come by, since you’ll have to decide on your own which metrics to track—and task yourself with the data entry and processing.
Dynamic reports from your restaurant POS software should help you track the most important benchmarks. The 8 reports below will help you get a better picture of the overall performance of your business.
Sales Reports
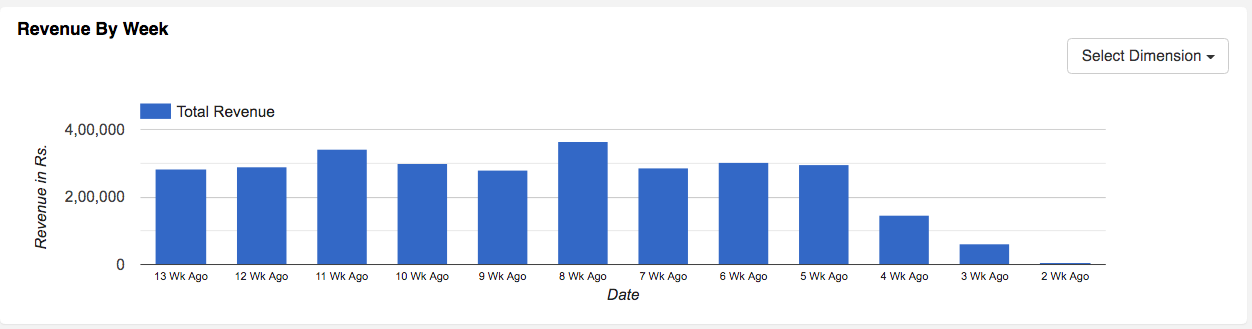
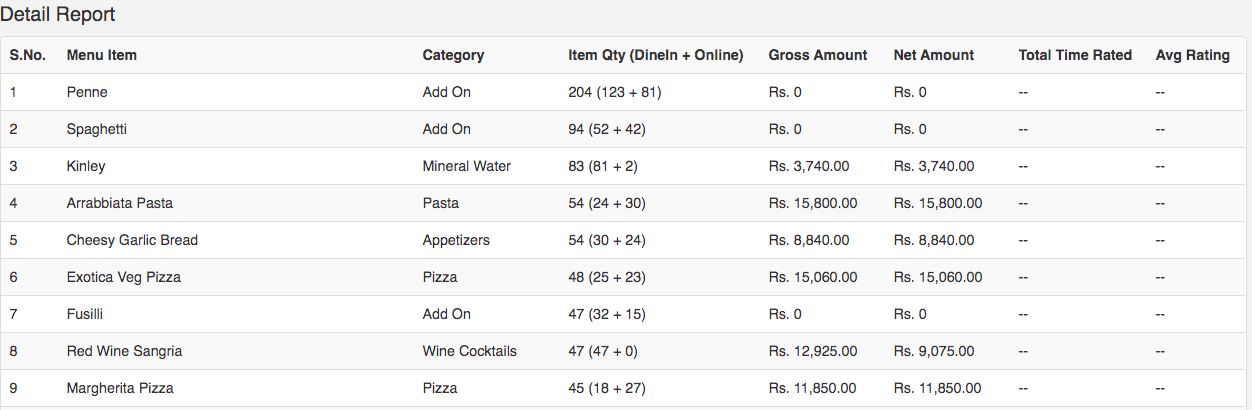
Sales reports don’t just mean sales numbers. A look at the sales breakdown weekly, monthly and quarterly helps you analyse sales patterns.
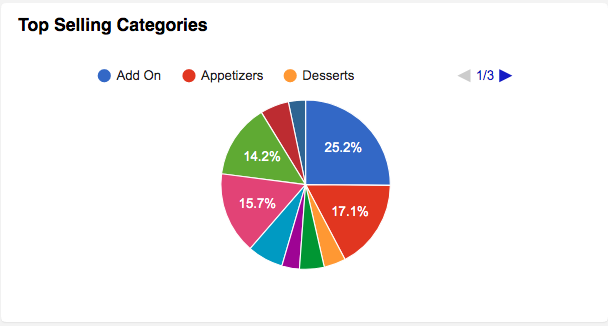
Also, a breakdown at the food category or food item level can also help you get a better understanding of which categories/items work best.
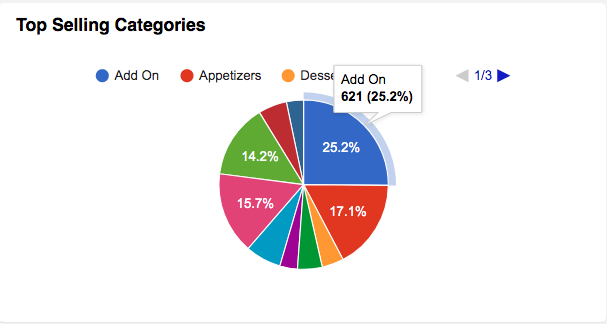
Top selling items reports also tell you about the items sold the most. This along with the ‘Food Costing’ report will help you analyse the items that have the highest and lowest profit margins.
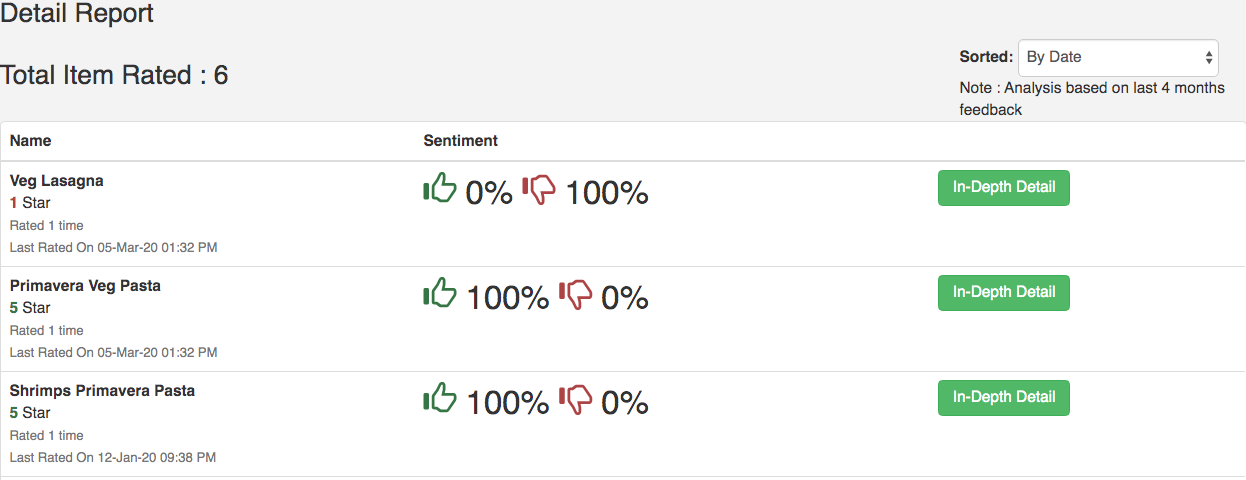
SpeQue restaurant POS software also provides dish wise rating reports. This can be combined with sales reports at the category/item level and food costing data to engineer your menu as well.
Key Performance Indicators (KPIs)
KPIs are the parameters that have the most effect on the health of your restaurant business.
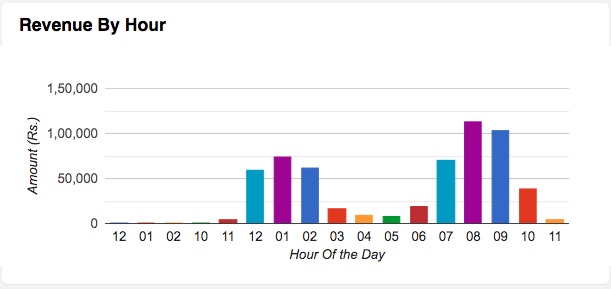
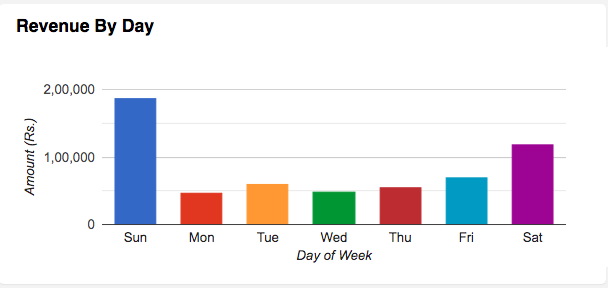
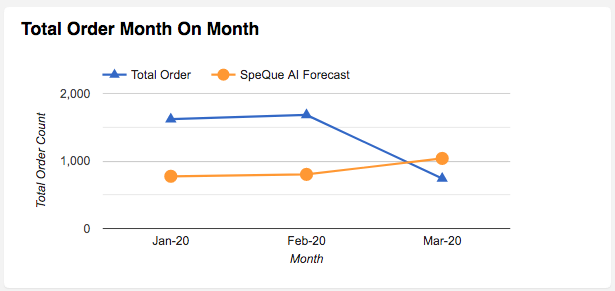
SpeQue KPI dashboard provides a daily, weekly and quarterly breakdown of sales data and revenues. It also gives the overall revenue information along with SpeQue AI forecast information.
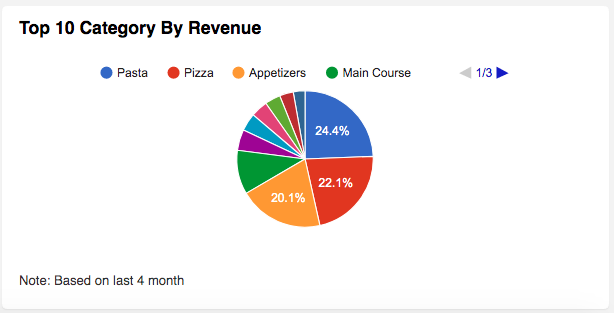
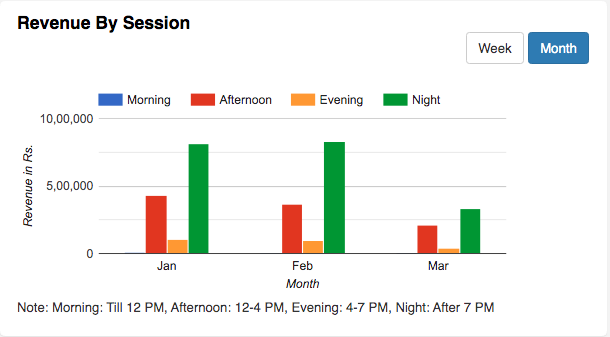
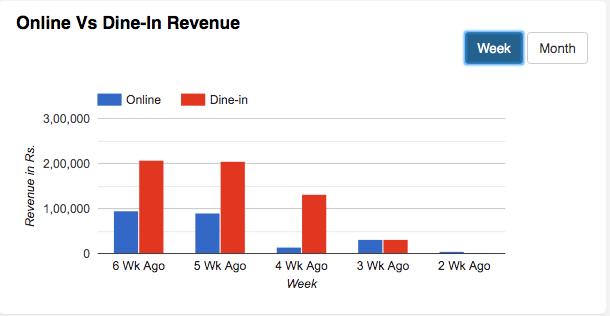
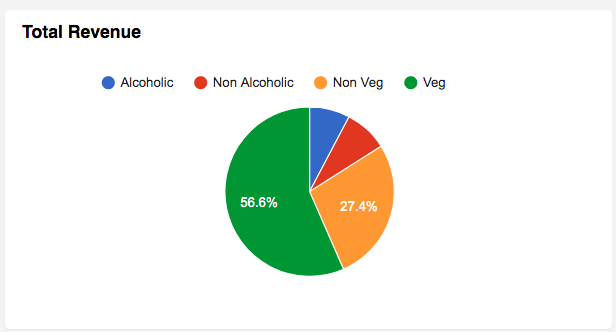
It also provides online vs dine-in revenues, session wise revenue breakdown, top most selling items and sub-category wise breakdown. (e.g. veg vs non-veg, alcoholic vs nonalcoholic etc.)
Inventory Reports
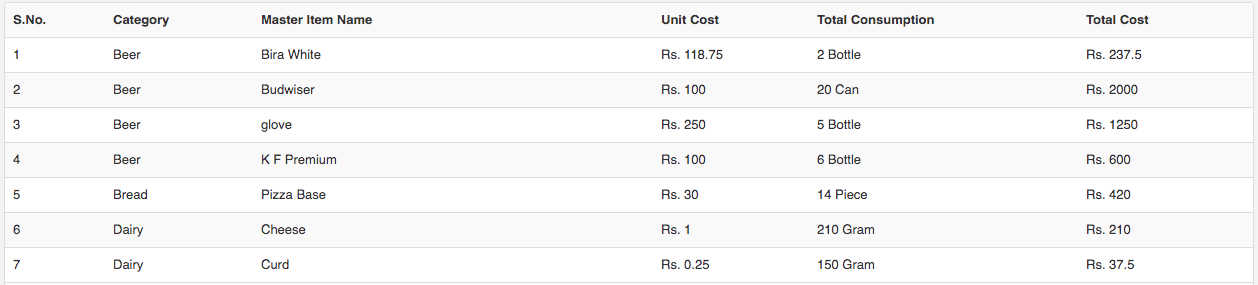
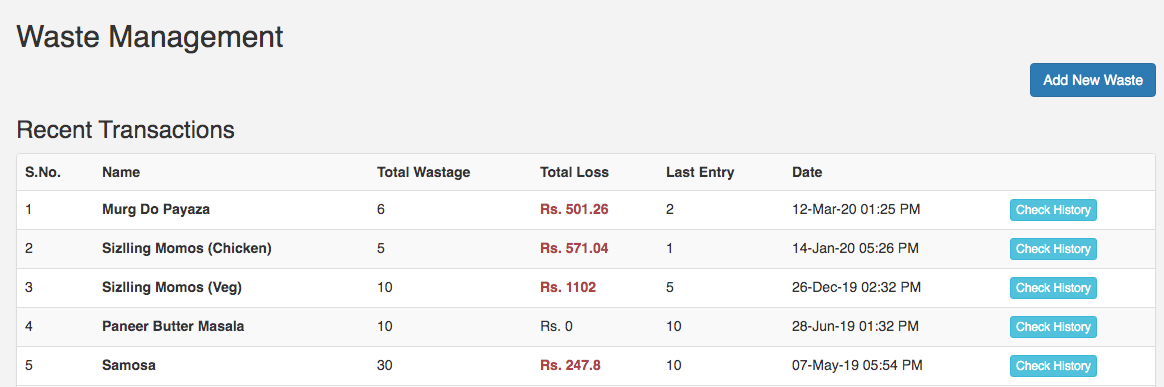
Inventory management reports can help you provide an insight into the stock consumed and quantity of stock wasted, on a daily and weekly basis.
Food Costing Reports help to keep a check on food cost and maintain the selling price of menu items accordingly. This along with the menu analytics goes a long way to improve profits for your restaurant.
Feedback Reports
As you might be aware, SpeQue restaurant management software comes with an integrated feedback system. So feedback reports can also be leveraged.
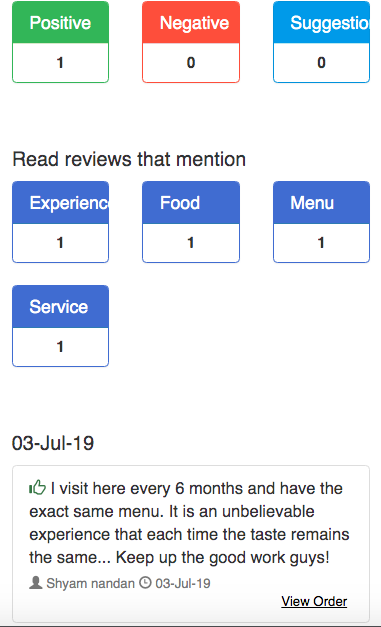
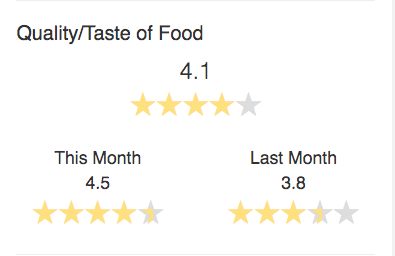
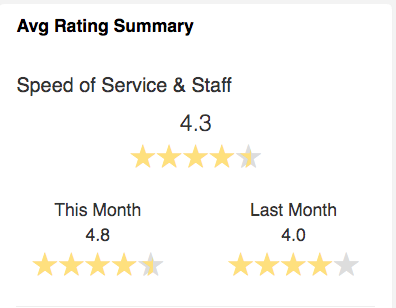
SpeQue feedback dashboard provides in-depth analysis of all feedback collected from customers. You can check the ratings for different feedback parameters and compare their performance over time (weekly/monthly).
SpeQue feedback dashboard also provides sentiment analysis for comments entered by customers. This saves a lot of manual time and effort in reading and analysing these comments.
Menu Analysis Reports
Top Selling Items report and dish wise rating dashboard can be used to look into menu performance and engineer the menu whenever required.
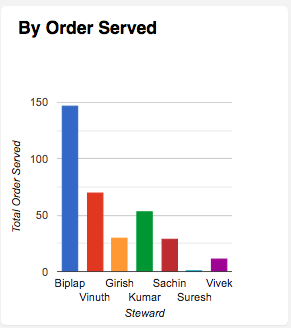
Staff Performance Reports
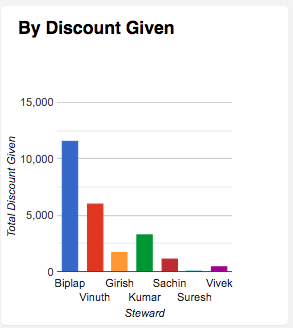
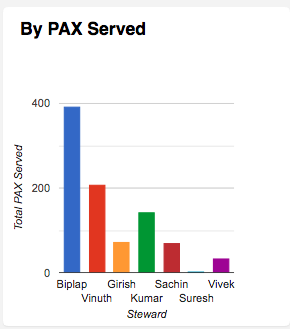
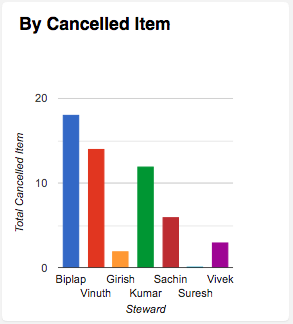
Staff Performance report gives a quick snapshot of the performance of each staff (stewards/captain).
Information such as how much sale each of the staff is doing, how many patrons each of them is serving, who is applying most discounts, who is cancelling most dishes etc can easily be figured out.
This report also helps you reward your best performing staff.
Customer Relationship Management (CRM)
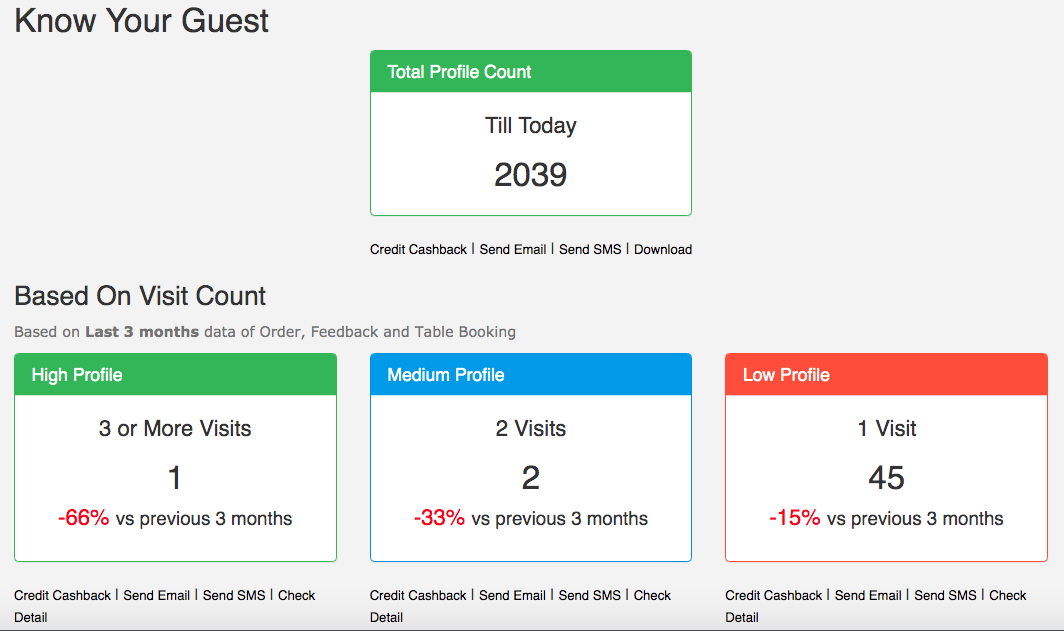
SpeQue restaurant POS system comes with an integrated CRM system as well.
CRM analytics dashboard provides some of the most useful information about your customers.
Along with their profiles, CRM dashboard also categorises your customers into different buckets. This kind of profiling is really helpful while running targeted campaigns to increase customer retention.
Fraud Detection Reports
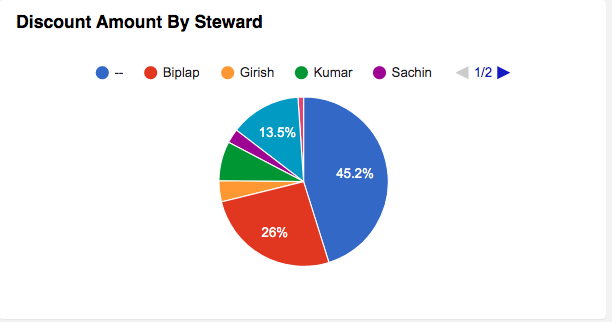
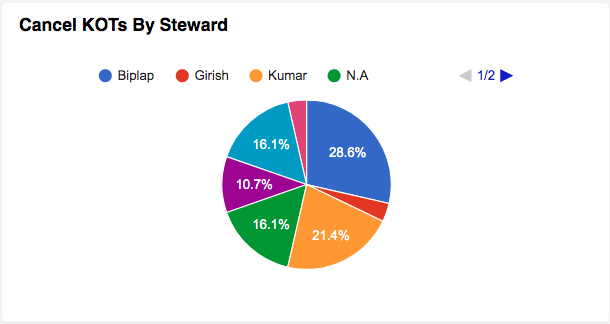
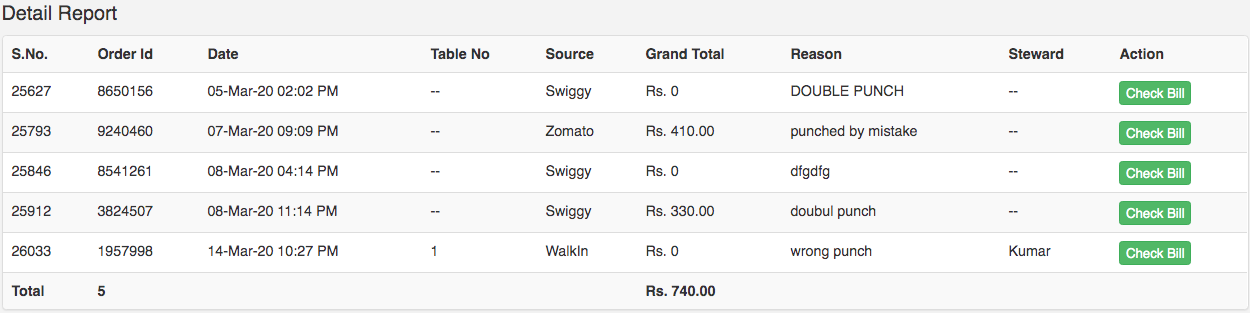
Reports such as cancelled items reports, discount reports and non-chargeable bills reports help you keep a check on the sales exceptions that might take place. These reports help to keep a check on theft and pilferage as well.
Reporting and data analytics provide insight for businesses to make better, informed decisions. Our reporting and analytics dashboard provides you with in-depth information that can help you grow your business. Write to us at info@speque.com to know more.
Solution Built For Your Restaurant
Schedule a FREE demo from our expert to know how SpeQue can help you in your business growth.
Request Free Demo
Comments
Comments are closed